Inferential Statistics(12)-Non-parametric tests
1. Non-parametric statistics
-
t-test
- to compare 2 independent means
-
Assumptions
- independent observations(random assignment/selection)
- normally distributed?(one-sided test) (usually > 30)
-
Assumptions
- to compare 2 independent means
-
ANOVA
- A quantitative response variable has a categorical explanatory variable.
-
Assumptions
- Independent random samples(random sampling or a randomized experiment)
- normal population distributions with equal standard deviations.(n in each group ≧ 10)
-
Assumptions
- A quantitative response variable has a categorical explanatory variable.
-
t-test vs. ANOVA
- t-test 只关注两组样本直接的差异。ANOVA关注多个样本。
- t-test 假设两组样本均值相等,置信区间为两组差值范围。 ANOVA假设factor(Categorical variable)导致多个样本组均值,置信区间可用t-test计算.
- t-test为t分布。ANOVA为F分布。
-
Non-parametric statistics
-
do not assume a particular form of distribution, such as the normal distribution, for the population distribution.
-
对于总体/样本正态性未知或非正态分布
-
小样本<20
-
排列参数(Ordinal/rank)
-
-
-
2. Wilcoxon Test: Comparing Mean Ranks(Two independent samples)
The test comparing two groups based on the sampling distribution of the difference between the sample mean ranks.
-
Assumptions
- Independent random samples from two groups
- random sampling
- randomized experiment
- Independent random samples from two groups
-
Hypotheses:
- \[H_0= Identical\ population \ distributions \ for \ the \ two \ groups \\ (this \ impllies \ equal \ population \ mean \ ranks.)\]
- \[H_a = Different \ population \ mean \ ranks \ (two-sided) \\ H_a = Higher \ population \ mean\ rank\ for \ a \ specified \ group \ (one-sided)\]
-
Test statistic:
- Difference between sample mean ranks for the two groups
-
P-value
- One-tail or two-tail probability depending on Ha, that the difference between the sample mean ranks is as extreme or more extreme than observed.
-
Conclusion
- Interpret in context
3. Large-Sample P-Value Use a Normal Sampling Distribution(Z-test)
Using the normal distribution for the large-sample(n>20) test does not mean we are assuming that the normal distribution for the response variable has a normal distribution. We are merely using the fact that the sampling distribution for the test statistic is approximately normal.
-
Z-test \(z = (difference\ between \ sample \ mean \ ranks)/ se\)
-
P-Value
- Asymp.Sig.(two-tailed)

4. Nonparametric Estimation(CI) Comparing Two Groups
-
Additional assumption
- the population distributions for the two groups have the same shape.
-
Point estimate for group difference

5. Wilcoxon rank-sum test(Mann-Whitney U test) (Two independent samples)
-
U-test
-

-

-
where R1 = sum of the ranks for group 1 and R2 = sum of the ranks for group 2.
-
-
In every test, we must determine whether the observed U supports the null or research hypothesis. This is done following the same approach used in parametric testing. Specifically, we determine a critical value of the smaller U such that if the observed value of U is less than or equal to the critical value, we reject H0 in favor of H1 and if the observed value of U exceeds the critical value we do not reject H0.
-
U-table
6. Kruskal-Wallis Test: Comparing mean ranks of several group
-
Assumptions:
- Independent random samples from several groups, either from random sampling or a randomized experiment.
-
Hypotheses:
- \[H_0: Identical \ population \ distributions \ for \ the \ g \ groups \\ H_a: Population \ distributions \ not \ all \ identical\]
-
Test statistic:
-
Uses between-groups variability of sample mean ranks
- \[K=(\frac{12}{n(n+1)})\sum n_i(\overline{R_i}-\overline{R})^2\]
-
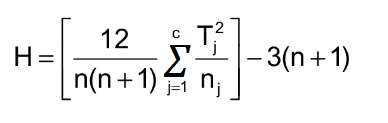
- Ri = sample mean rank
- R = the combined sample mean of g groups
- n = total number of data points
- df = g-1
-
-
P-value
-
test statistic value from chi-squared distribution with df=g-1
-

-
-
Conclusion
- If the P-value is small, to find out which pairs of groups significantly differ, we could follow up the Kruskal-Wallis test by a Wilcoxon test to compare each pair.
7. Sign test: Comparing Matched Pairs(Dependent samples)
-
Assumptions
- Random sample of matched pairs for which we can evaluate which observation in a pair has the better response.
- pretend the equal data points do not exist
-
Hypotheses
- \[H_0: Population \ proportion \ p \ = \ 0.5 \\ H_a: \ p ≠ 0.5 \ (two -sided) \\ or \ H_a: \ p> 0.5 \ or \ p<0.5 \ (one-sided)\]
-
Test statistic
- \[Z = \frac{(\hat{p}-0.5)}{se} \\ se = \sqrt{(0.5)(0.5)/n}\]
-
P-value
-
for large samples(n>30), use tail probabilities from standard normal. (z-score)
-
for smaller n, use binomial distribution
- \[P(x)=\frac{n!}{x!(n-x)!}p^x(1-p)^{n-x}\]
- binomial distribution table
-
8. Wilcoxon Signed-Rank test: Ranking and Comparing Matched Pairs(Dependent samples)
-
Assumption
-
Random sample of matched pairs for which the differences of observations have a symmetric population distribution and can be ranked.
-
Hypotheses
- \[H_0: Population \ median \ of \ difference \ socres \ is \ 0 \\ H_a: Population \ median \ of \ difference \ scores \ in \ not \ 0 \ (one-sided \ also \ possible)\]
-
Test statistic

- Rank the absolute values of the difference scores for the matched pairs
- find the sum of ranks for those differences that were positive
-
P-value
- a P-value based on all the possible samples with the given absolute differences
- for large samples, it uses an approximate normal sampling distribution.
-
Conclusion
- the smaller W such that if the observed value of W is less than or equal to the critical value, we reject H0 in favor of H1 and if the observed value of W exceeds the critical value we do not reject H0.
-
Notes:
-
Because of Wilcoxon signed ranks test’s extra assumption of Symmetry, many statisticians prefer to use the matched pairs t test for such data.
-
How to select the right t-test to compare two sample means?

-
9. Spearman ranked correlation
- Correlation coefficient = standardized measure of association

| Pearson | Spearman |
|---|---|
| Parametric | Non-parametric |
| [-1,1] | [-1,1] |
| 1. linear association 2. variables are bivariate normally distributed 3.sensetive to outliers and skewedness |
1. non -linear association 2. measures strength of monotonic function(单调函数) 3. ordinal variable 4. can contain outliers 5. non-normal distribution is okay |
10. Runs Test for Randomness
A runs test is a statistical procedure that examines whether a string of data is occurring randomly from a specific distribution. The runs test analyzes the occurrence of similar events that are separated by events that are different.
-
A run is a succession of identical values or labels which are followed and preceded by different values or labels.

-
two variation form

-
run test properties
-
only consider binominal data
-
numerical data
- values above/below mean
- increasing/decreasing values
-
more than two categories
- aggregate to two
-
ordering is crucial
- don’t re-arrange data
-
-
runs test
count number of runs in the data.

- group sizes: m or n <10
 probability table
 - m or n > 10 z-test
-

- total sample size N = m + n
-
- group sizes: m or n <10